
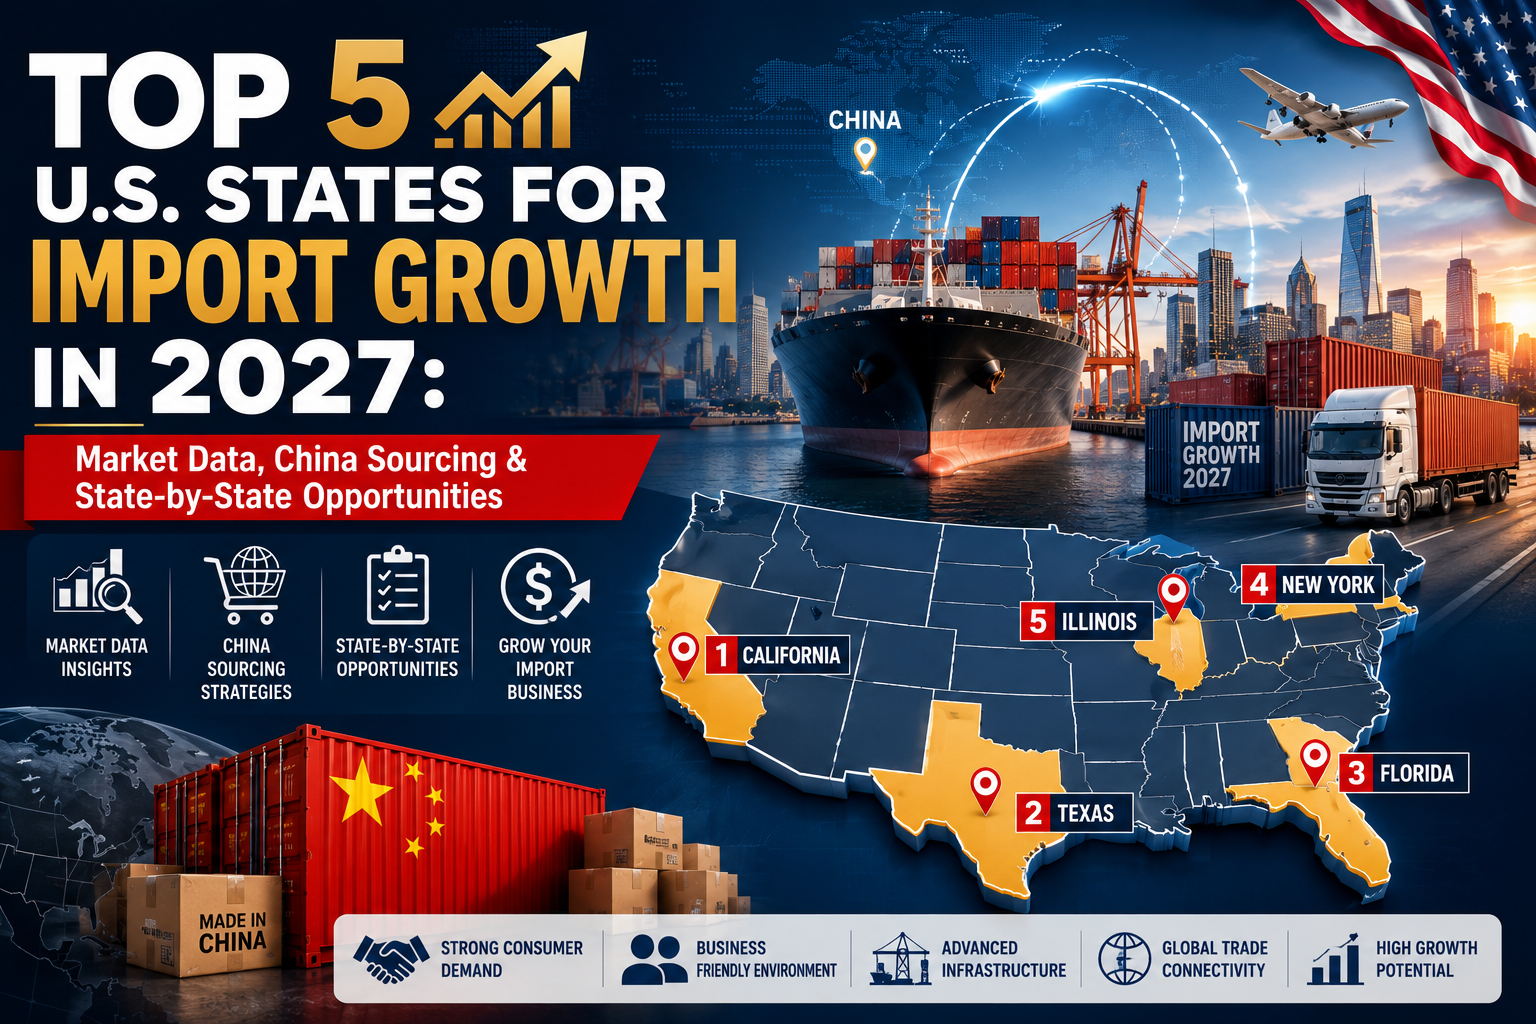
Market Data, China Sourcing & State-by-State Opportunities
Part 1 of 2 — this piece covers the state-level market data and China sourcing landscape. Part 2, “The 2027 U.S. Import Playbook,” covers product categories, country comparisons, margins, and the risk/roadmap side.
Methodology note: figures below are drawn from U.S. Census Bureau trade data, the Office of the U.S. Trade Representative’s state trade profiles, state comptroller and trade-office reports, and industry trade publications, current as of mid-2026. Anything forward-looking is labeled as a projection or estimate rather than presented as fact — trade data lags by months, and 2027 numbers don’t exist yet. Sources are listed at the end of each state section.
Introduction
Every few years someone declares that importing into the U.S. is either about to boom or about to collapse, and the truth is usually somewhere unglamorous in between. 2027 looks like one of those in-between years — tariff policy is still shifting under a series of court rulings and new Section 301 actions, freight costs have mostly normalized after the pandemic-era spikes, and consumer demand is steady rather than surging. None of that makes for a great headline. It does make for a decent year to actually plan.
What’s changed is where the opportunity sits. National import totals tell you almost nothing useful anymore — they average together a state where imports are dominated by crude oil and a state where they’re dominated by jewelry, and the resulting number describes neither. State-level demand, port infrastructure, and industry concentration are what actually determine whether a product category is worth pursuing in a given market.
This piece looks at the five states that consistently show up at the top of U.S. import volume — California, Texas, New York, Florida, and Illinois — and what’s actually driving demand in each one going into 2027. Part 2 picks up from here with the product-category and country-comparison side of the picture.
The Global Import Landscape Heading Into 2027
A few things are true at once right now, and none of them cancel each other out.
Tariff policy on China is still in motion. The Supreme Court struck down the broad IEEPA-based tariffs in February 2026 — the ones that had pushed some China-origin rates as high as 145%. That ruling only touched IEEPA authority, though; Section 301 tariffs on China, which rest on separate legal grounds under the Trade Act of 1974, stayed fully in place. A replacement Section 122 surcharge, capped at 15%, brought the effective ceiling on Chinese goods down to somewhere around 40% for most categories — still steep by historical standards, but a real step down from the IEEPA peak. As of mid-2026, exclusions covering roughly 178 specific products had been extended into November, and a separate investigation into forced labor and industrial overcapacity across dozens of trading partners, China included, is likely to reshape the numbers again before 2027 opens. The honest planning advice: check the current rate before committing to a sourcing decision, because it has moved several times in the past year and will probably move again.
The $800 de minimis exemption is also gone for Chinese goods, suspended in February 2026 — every shipment now needs formal customs entry regardless of value, which hit small-parcel e-commerce importers especially hard.
And diversification has stopped being advice people give and started being something the data actually shows. State and industry reports through 2025–2026 consistently show sourcing splitting across Mexico, Vietnam, and India even in states where China remains the single largest supplier.
Why China Still Leads Manufacturing — Even at a ~40% Effective Tariff
Worth asking directly: if the combined tariff burden on Chinese goods sits near 40%, why does it still show up as the top or second-largest import source in four of the five states covered here? Not sentimentality, and not inertia. The alternative usually isn’t “the same product, cheaper” — it’s a thinner, less complete supply chain.
China’s manufacturing base still offers a few things that are genuinely hard to copy: a dense component and materials ecosystem (PCB fabrication, injection molding, and parts sourcing sitting in the same regional cluster for electronics; tanneries, hardware suppliers, and finishing shops within days of each other for leather goods and apparel), strong OEM/ODM flexibility for buyers without an in-house product development team, and sample turnaround speed that newer manufacturing hubs — still building out their own supplier networks — generally can’t match yet.
Where China is weaker heading into 2027: tariff exposure on final assembly, rising labor costs relative to Vietnam and Bangladesh in labor-intensive categories, and growing compliance friction around forced-labor due diligence rules aimed specifically at Chinese supply chains. None of that erases China’s position. It just means “China + 1” — core sourcing in China, final assembly or overflow elsewhere — has become the default rather than the exception.
State 1: California
Market snapshot. California is the fourth-largest economy in the world in its own right, with a gross domestic product approaching $4.3 trillion. The state imported about $488 billion in goods from the world in 2025 — a slight dip from roughly $491 billion in 2024 — still the largest merchandise import volume of any U.S. state, anchored by the ports of Los Angeles and Long Beach.
2025 performance. Computer and electronic products were California’s single largest import category in 2025, at roughly $176 billion, ahead of transportation equipment, electrical equipment, and nonelectrical machinery. The sourcing mix shifted meaningfully in a single year: imports from China dropped to roughly $76 billion in 2025, down sharply from about $123 billion the year before, while imports from Taiwan rose from around $40 billion to roughly $63 billion over the same period — a concrete, dollar-figure example of the diversification pattern, not just a talking point. China still held its position as California’s largest single source country, at around 15–16% of total imports, ahead of Taiwan, Mexico, Vietnam, and South Korea.
What this means for importers. California stays the default entry point for electronics, apparel, and general consumer goods on port infrastructure and market size alone — but the swing toward Taiwan in the very same product categories in a single year shows the diversification isn’t theoretical for buyers already operating at scale. Anyone entering electronics or component sourcing through this market should plan for continued movement in the country mix, not a fixed supplier map.
Pakistan opportunity. California’s large South Asian and Middle Eastern diaspora communities support real, if modest, demand for home textiles, leather goods, and specialty dried foods — a niche entry point rather than a driver of the state’s headline import numbers.
Sources: California Chamber of Commerce trade statistics; Beacon Economics California Trade Report; U.S. Trade Representative state trade profile.
State 2: Texas
Market snapshot. Texas imported roughly $412 billion in goods in 2025, up close to 4% from 2024. Unlike California, Texas’s trade runs on its land border with Mexico rather than ocean ports — the Port of Laredo alone handled well over $300 billion in total trade in the most recent full year, and Mexico accounted for roughly $85 billion of Texas’s import total, largely tied to cross-border manufacturing.
2025 performance. Digital processing units and miscellaneous electronic components led Texas’s import categories at roughly $66 billion, about 16% of the state’s total. Beyond that, automobiles, crude oil, telephones, computers, and refined petroleum round out the major categories, sourced primarily from Mexico, Canada, China, Japan, and Vietnam. For anyone specifically in wood furniture: Texas’s forest-product imports reached roughly $5.2 billion in the most recent full year, with wooden furniture making up close to a third of that and Texas ranking as the second-largest furniture-importing state nationally.
What this means for importers. Texas is the strongest fit in this list for industrial supplies, construction materials, workwear, and outdoor or agricultural equipment — tied to the state’s energy and construction sectors rather than a consumer retail base. The Mexico land-border logistics also make Texas a natural hub for a “China + Mexico” hybrid supply chain, since trucking from Mexican manufacturing hubs into Texas is often faster and cheaper than ocean freight into a coastal port.
Pakistan opportunity. Workwear, denim, and leather gloves — areas where Pakistani manufacturing has real depth — line up more directly with Texas’s industrial and outdoor-equipment demand than with any other state on this list.
Sources: World’s Top Exports Texas trade data; U.S. Trade Representative state trade profile; Texas Forest Service trade report; regional trade press coverage of Texas–Mexico trade.
State 3: New York
Market snapshot. New York’s imports totaled a little over $213 billion in 2025 — a much smaller volume than California or Texas, but with a completely different composition. Miscellaneous items clad in precious metals alone made up close to a third of the state’s total imports, reflecting New York’s role as the country’s jewelry and precious-metals trading hub, centered on the diamond district and the broader luxury retail economy. Beyond precious metals, textiles and leather, electronics, and machinery are the next-largest categories.
Sourcing mix. China, Canada, and India rank among New York’s top import-source countries, alongside Switzerland, which shows up heavily given the precious-metals trade specifically. It’s a genuinely different sourcing map than the rest of this list, shaped by finance and luxury retail rather than industrial or consumer-electronics demand.
What this means for importers. New York fits premium home products, fashion accessories, and decor aimed at a luxury or near-luxury price point — categories where the state’s retail density and its role as a wholesale and re-export hub for the broader Northeast do real work for a smaller importer who hasn’t built national distribution yet.
Pakistan opportunity. Embroidered home décor and higher-end woven textile accessories can find footing through New York’s wholesale fashion and home-goods channels, though this is a smaller, more specialized opportunity than in Texas or Florida.
Sources: World’s Top Exports New York trade data; New York State Comptroller’s office reports on tariff impact and NYC metro trade; MSU globalEDGE state trade statistics.
State 4: Florida
Market snapshot. Florida’s trade runs through the Miami Customs District — Miami-Dade, Broward, and Palm Beach counties — which handled roughly $144 billion in total trade in the most recent full year, split between about $78 billion in exports and $66 billion in imports. More recent district-level data puts imports at around $64 billion against exports of about $84.5 billion — Florida is one of the few major import states that actually exports more than it imports through its primary customs district, largely on the strength of re-exports to Latin America and the Caribbean.
2025 performance. China remained Florida’s top single-country import source, at roughly $15 billion, concentrated in electronics — though separate reporting on the Miami Customs District specifically flagged a shift in imports away from China and toward Vietnam and Latin American suppliers, the same diversification pattern showing up yet again, in a completely different state and product mix than California’s. Mexico (automobiles), Canada (energy products), and France (aircraft components) round out the other major sources, each in the $4–6 billion range.
What this means for importers. Florida’s strength is less about raw volume and more about function — it’s the country’s primary gateway to Latin America and the Caribbean, and its economy runs on tourism, hospitality, and re-export logistics rather than domestic manufacturing input. Beach and outdoor products, hospitality textiles, party and event supplies, and dried foods all have a stronger natural fit here than in, say, Illinois.
Pakistan opportunity. This is arguably the strongest state-level fit for Pakistani home textiles on this list — hotel and hospitality linens, towels, and bedding line up closely with Florida’s hospitality-driven demand, and the state’s re-export role to Latin America adds a second market layered on top of direct U.S. retail demand.
Sources: Global Miami magazine “State of Trade” report; Miami-Dade County trade office data; FreightAmigo Florida trade analysis; U.S. Trade Representative state trade profile.
State 5: Illinois
Market snapshot. Illinois was the third-largest goods importer among U.S. states in the most recent full year, bringing in a little over $218 billion — about 6.7% of the national total — behind only California and Texas. Canada was the top import source at close to $64 billion (about 30% of the state total), followed by China at roughly $42 billion, Mexico at around $19 billion, Vietnam at about $13 billion, and Germany at roughly $8.5 billion.
2025 performance. Illinois ranks second among all U.S. states specifically for imports from China — a notable detail on its own, given that a Midwest logistics and manufacturing hub is outranking most coastal states on direct China sourcing volume. Within the Chicago metro specifically, Japan was actually the largest single trade partner through O’Hare in the most recent reporting year, ahead of China and Germany — a reminder that O’Hare’s air-cargo profile and the state’s broader import numbers, which include river and rail-served inland ports, tell somewhat different stories depending on which slice of “Illinois trade” you’re looking at.
What this means for importers. Illinois functions as a distribution and inland-logistics hub for the whole Midwest, not just a consumption market on its own — its warehousing, rail, and trucking infrastructure make it a strong choice for importers whose end customers are spread across several Midwest states rather than concentrated locally. Kitchen products, home organization goods, winter-specific goods, and general industrial supplies all move efficiently through this network.
Pakistan opportunity. Rice, dried fruits, and general home-goods categories can move through Illinois’s distribution infrastructure toward Midwest grocery and specialty-retail channels — more a logistics fit than any single standout category.
Sources: Illinois Manufacturers’ Association / Midwest Manufacturing Association trade report; Illinois General Assembly monthly trade briefing; Chicago Council on Global Affairs; Illinois Department of Commerce trade data; MSU globalEDGE state trade statistics.
Cross-State Competition Snapshot
A few patterns repeat across all five states, worth naming directly rather than state by state:Mexico and Canada dominate raw national import volume, largely on energy, automotive, and USMCA-linked manufactured goods — but that volume sits in categories most small and mid-sized importers aren’t competing in anyway.
China remains the largest or second-largest source of manufactured consumer goods in four of the five states, even after the tariff and diversification shifts of 2025–2026.
Vietnam shows up as a rising secondary source in every state examined here, most visibly in Florida’s shift away from China and in Texas’s and Illinois’s existing import mix.
India appears consistently in New York’s and Illinois’s top import-source lists, reflecting its growing role in textiles and electronics assembly.
Final Outlook
None of these five states are competing for the same importer, and that’s really the point. California and Texas both move enormous volumes of electronics and industrial goods, but through completely different logistics models — ocean freight through the busiest port complex in the country versus land-border trucking through Laredo. New York and Florida both skew toward higher-value, non-industrial goods, but one runs on jewelry and luxury retail, the other on tourism and Latin American re-export. Illinois is the odd one out in a useful way — less a destination market, more a distribution engine for everywhere around it.
Part 2 of this report picks up from here, moving from “which state” to “which product”: a category-by-category look at where 2027 demand is heading, how China stacks up against Vietnam, India, Bangladesh, Turkey, Mexico, and Pakistan, and what realistic margins and risk look like once landed costs are factored in properly.